DTC P0420 CATALYST SYSTEM EFFICIENCY BELOW THRESHOLD (BANK 1)
| DTC P0420 CATALYST SYSTEM EFFICIENCY BELOW THRESHOLD (BANK 1) |
| OUTLINE OF DIAGNOSIS |
Detect the deterioration of catalyst function.
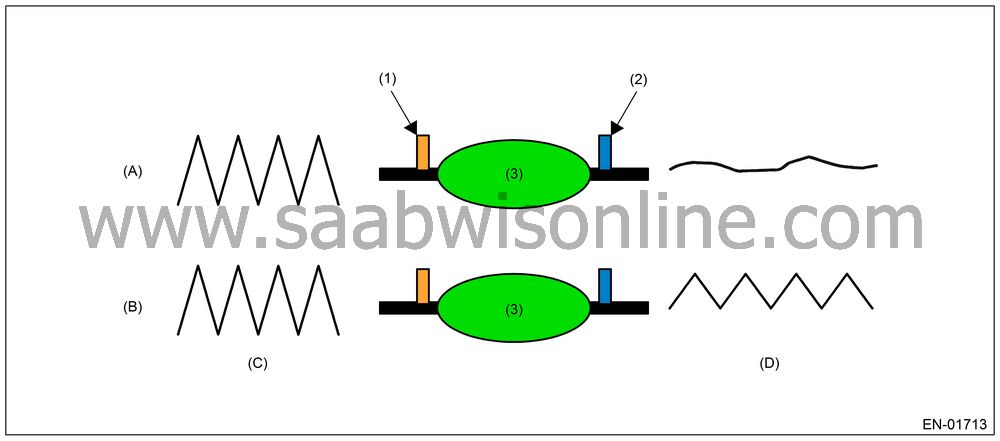
Though the rear oxygen sensor output would change slowly with a new catalyst, the sensor output with a deteriorated catalyst becomes high and the inversion time is shortened. For this reason, the catalyst diagnosis is carried out by monitoring the rear oxygen sensor output and comparing it with the front A/F sensor output.
| COMPONENT DESCRIPTION |

|
(1)
|
Front oxygen
(A/F) sensor
|
(A)
|
Normal
|
|
(2)
|
Rear oxygen
sensor
|
(B)
|
Deterioration
|
|
(3)
|
Catalyst
|
(C)
|
Front oxygen
(A/F) sensor waveform
|
|
(D)
|
Rear oxygen
sensor waveform
|
| ENABLE CONDITION |
| Secondary Parameters | Enable Conditions |
|
Battery
voltage
|
> 10.9
V
|
|
Atmospheric
pressure
|
> 75.1
kPa (563 mmHg, 22.2 inHg)
|
|
Engine
coolant temperature
|
≥ 65°C
(149°F)
|
|
Catalyst
warm-up counter on Map 2
|
≥ 7,600
|
|
Misfire
detection during 200 engine revs.
|
< 5
times
|
|
Learning
value of evaporation gas density
|
< 0.20
|
|
Sub
feedback
|
Operating
|
|
Evaporative
system diagnostic
|
Not
in operation
|
|
Difference
between actual and target time lambda < 0.10
|
1,000
milliseconds or more
|
|
Vehicle
speed
|
≥ 75
km/h (46.6 MPH)
|
|
Engine
speed
|
1,600 ←→ 3,500
rpm
|
|
Amount
of intake air
|
10 ←→ 36
g/s
|
|
Engine
load change every 0.5 engine revs.
|
< 0.03
g/rev
|
|
Rear O
2
output
change from Lean to Rich
|
Experienced
after fuel cut
|
Map 2
Add the following value every 524.288 milliseconds.Catalyst warm-up counter ≤ 7,500
| Amount of intake air (g/s) | 0 | 4.7 | 9.4 | 14.1 | 18.8 | 23.4 | 28.1 | 32.8 | 37.5 | 42.2 | 46.9 | 51.6 |
|
Integrated
value for warm-up counter
|
−15.7
|
−1
|
15.9
|
31.7
|
47.5
|
63.3
|
79.1
|
94.8
|
111
|
126
|
126
|
126
|
Catalyst warm-up counter > 7,500
| Amount of intake air (g/s) | 0 | 4.7 | 9.4 | 14.1 | 18.8 | 23.4 | 28.1 | 32.8 | 37.5 | 42.2 | 46.9 | 51.6 |
|
Integrated
value for warm-up counter
|
−5.3
|
−2
|
6.3
|
8.4
|
9.9
|
11.0
|
12.0
|
12.8
|
13.5
|
14.1
|
14.6
|
15.1
|
| GENERAL DRIVING CYCLE |
Perform the diagnosis once at the constant vehicle speed from 80 to 100 km/h (49.7 to 62.1 MPH).
| DIAGNOSTIC METHOD |
After the malfunction criterias are completed, calculate cumulative value of front oxygen (A/F) sensor lambda deviation (Σ |(sglmd n − sglmd n-1 )|) and cumulative value of rear oxygen (A/F) sensor output voltage deviation (Σ |(ro2sad n − ro2sad n-1 )|).
Calculate the diagnosis value when the front oxygen (A/F) sensor output fluctuation value more than specified value.
Judge NG when the malfunction criteria below are completed, and judge OK when they are not completed.
Judgment Value
| Malfunction Criteria | Threshold Value |
|
Σ |(ro2sad
n
− ro2sad
n-1
)| / Σ |(sglmd
n
− sglmd
n-1
)|
|
≥ 4
|
Map 3
| Diagnosis value | 0.15 | 0.2 | 0.25 | 0.3 |
|
Judgment
value
|
4
|
6.5
|
9
|
12
|
Time Needed for Diagnosis: 30 — 55 seconds
Malfunction Indicator Light Illumination: Illuminates when malfunction occurs in 2 continuous driving cycles.
| DTC CLEAR CONDITION |
| • |
When the OK idling cycle was completed 40 times
in a row
|
|
| • |
When “Clear Memory” was
performed
|
|
| MALFUNCTION INDICATOR LIGHT CLEAR CONDITION |
| • |
When the OK driving cycle was completed 3 times
in a row
|
|
| • |
When “Clear Memory” was
performed
|
|
| FAIL SAFE |
None
| ECM OPERATION AT DTC SETTING |
| • |
Memorize the freeze frame data. (For test mode $02)
|
|
| • |
Memorize the diagnostic value and trouble
standard value. (For test mode $06)
|
|


