PWM signals
| PWM signals |
| Background |
In modern cars, information often has to be transmitted between different systems, sometimes also between the systems of different manufacturers. In this connection it has been found that analogue transmission of information is a somewhat unreliable method. Voltage losses in cables and connectors, as well as the tolerances of different control modules and their sensors, are some of the reasons for this unreliability.
| PWM (Pulse Width Modulation) |
The solution is to use PWM signals. With PWM, the time during which a voltage passes through the cable is the important thing, not the level of the voltage.
We can also describe the PWM signal as a square wave in which the width of the voltage pulses corresponds to our information. Since the voltage has only two states - on and off - we say that the signal is digital.
| An example |
Let us assume that a position sensor for the throttle butterfly sends a voltage to a MOTRONIC control module. The level of the voltage depends on how wide the throttle opening is, so that it is perhaps about 0.2 V at idling speed and about 4.5 V at full throttle. Accordingly, the voltage is proportional to the opening angle of the throttle butterfly and we say that the signal is an analogue one.
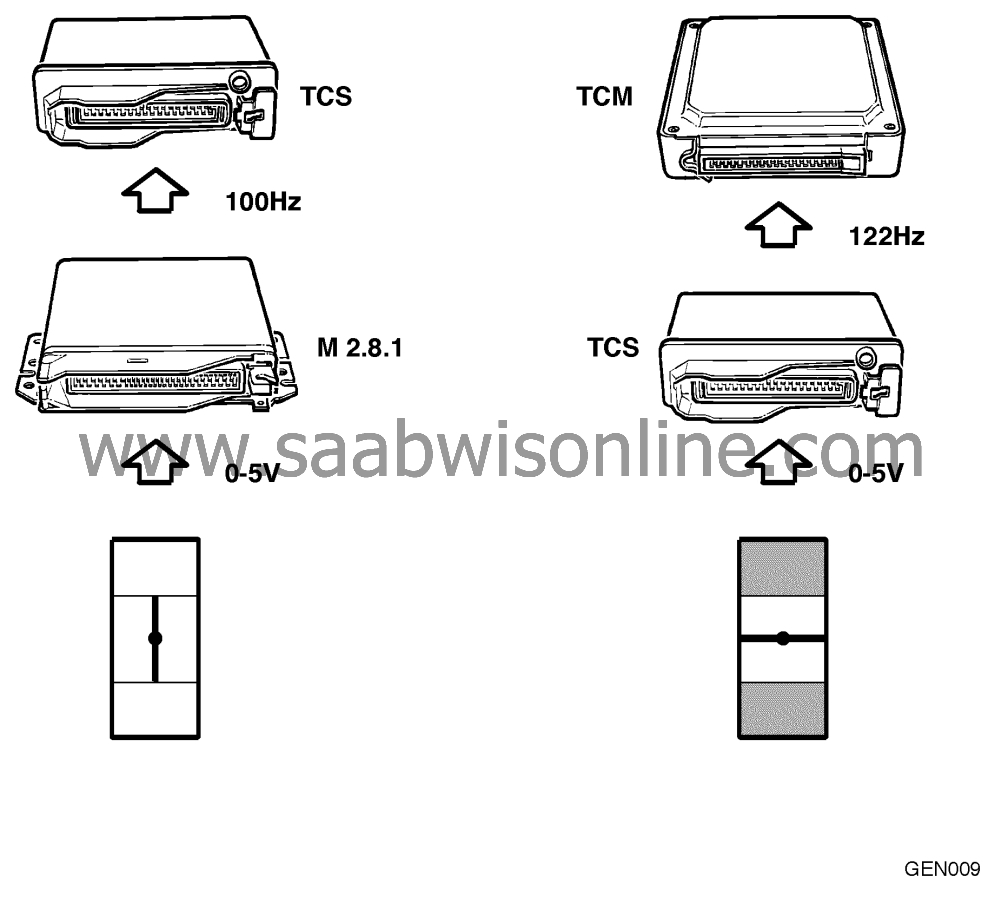
Information about the position of the throttle butterfly can also be passed on to other systems, such as the TCS, automatic transmission, etc. In such case it will not be in the form of an analogue voltage signal but as a PWM signal.
In this case, PWM signals always have a pulse ratio of 9%% at idling speed (higher when the throttle is opened), regardless of voltage losses or tolerances.
| PWM signal frequency |

Information that is sent from one control module to another often changes very quickly, so that the pulse width must also be capable of changing very quickly. It also follows from this that the pulses must be transmitted at an extremely fast rate, i.e. the signal must have a high frequency.
The PWM signal often has a fixed frequency of between 75 and 225 Hz, which means that the pulses are generated 75 to 225 times a second. *)
Common frequencies in automotive connections are 100, 122 and 200 Hz for transmitting control modules while receiving control modules often accept relatively wide departures from these frequencies. This ensures extremely reliable communication.
*) In exceptional cases the frequency is not fixed, such as that of the Tq RPM signal from the TRIONIC system. Here the frequency depends on engine rpm but the pulse width reflects the engine load.
| PWM signal characteristics |
Frequency
In itself, the frequency does not tell us anything about the value of the information passing down the line but it can confirm that we are in contact with the transmitting control module and we can check that it is within reasonable limits.Pulse duration
At a frequency of 100 Hz there are 100 pulses a second, which means that the duration of a single pulse can be at most 1/100th of a second, i.e. 10 milliseconds. Pulse duration at 100 Hz can thus vary between 0 and 10 milliseconds.Pulse ratio
If we have a pulse duration of 0.9 ms at 100 Hz, we say that the pulse ratio is 9%% (the duration of the pulse is less than 0.9 ms out of 10 possible). When information is transmitted, the pulse ratio is between 8%% and 92%%.| When the PWM signal is not to be considered a signal |
PWM can also be used for other purposes besides transmitting information between control modules. In such cases, PWM goes straight to a load (power- consuming unit) in the system and is not referred to as a PWM signal because it does not convey information in the strict sense.
An example of this is the instrument lighting which is supplied with PWM voltage. Here a low pulse ratio causes the lamps to shine weakly and a higher pulse ratio increases their intensity. Since the frequency is high, the human eye cannot perceive that the lamps flicker.
Other examples are the throttle actuator motor in the Traction Control System (TCS), the IAC valve, the BPC valve and the CP valve.
We can also say that the supply to the injectors is pulse- width modulated since the pulse width corresponds to their opening duration.
In the above example, mention is made of PWM outputs (transmitter) and PWM inputs (receiver). In regard to these inputs and outputs, the system manufacturer is free to choose whatever frequencies and pulse ratios he prefers. Some common frequencies are 70-90 Hz for the BPC valve in the TRIONIC system, 56-90 Hz for the instrument lighting, and 500 Hz for the TCS system throttle actuator motor.
| PWM measurement |

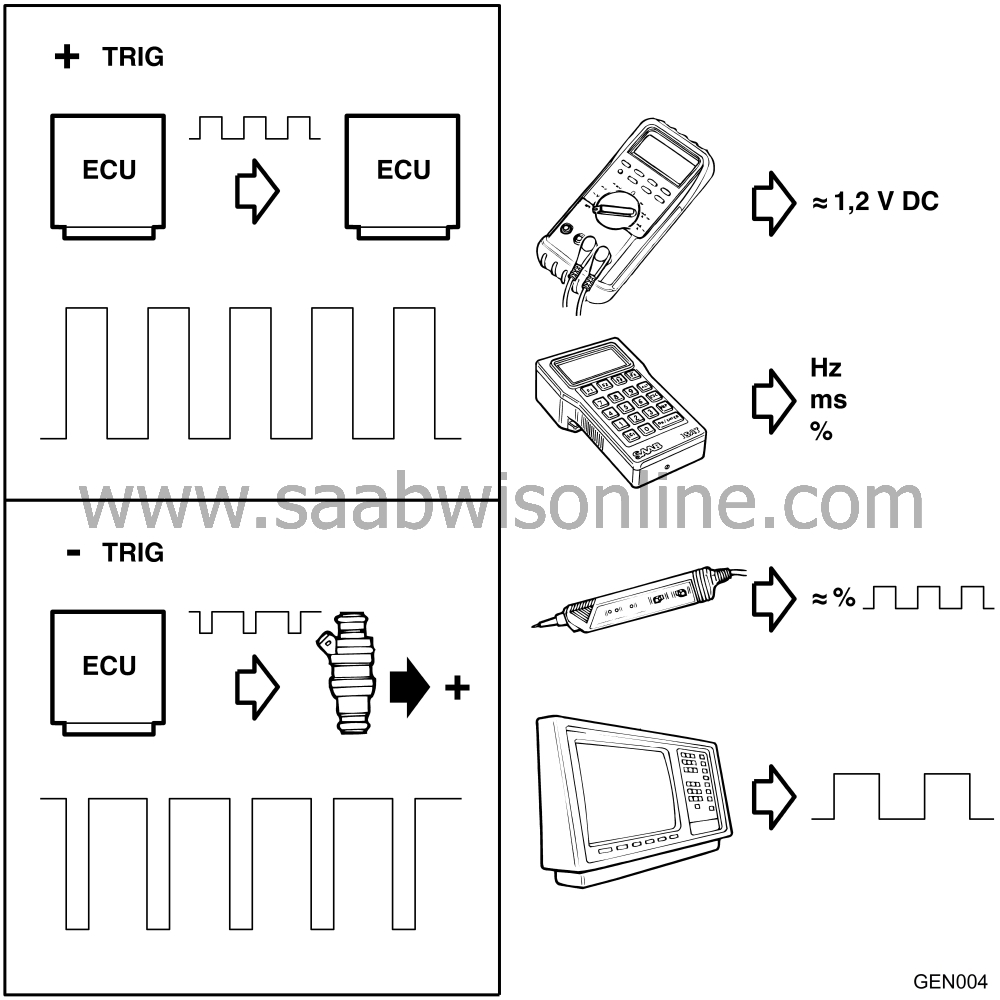
PWM signals , i.e. communication between control modules, are always triggered by a positive pulse, i.e. the pulse is a battery + (positive) pulse.
Other PWM outputs (inputs) are often triggered by a negative pulse. For instance, the injectors are supplied with a constant positive voltage and pulsed by ground (negative) signals from the control module.
| Measurement with a voltmeter |
If we measure PWM with a voltmeter, the meter will show the mean voltage applied to the lead so that a higher pulse ratio will give rise to a higher mean voltage.
By means of the voltmeter we can roughly estimate the pulse ratio. At a pulse ratio of 9%%a reading of about 1.2 V is usually obtained (0.09 x 13 V = 1.17 V).
In the case of PWM triggered by a positive pulse, connect the red test lead to the cable and the black test lead to a good ground. In the case of PWM triggered by a negative pulse, connect the black test lead to the cable and the red test lead to battery + (positive). Select the "Smooth" function on the voltmeter if it has this feature.
| Measurement with an ISAT or multimeter with a pulse measuring function |
Connect the red test lead to the cable and the black test lead to a good ground. Then select positive or negative triggering. Frequency, pulse duration and pulse ratio can then be measured.
| Measurement with Logic Probe |
Connect battery + (positive) supply voltage and a good ground. Then apply the tip of the probe to the cable. The Logic Probe shows the presence of pulses, if any, and gives a rough estimate of the pulse ratio.
| Measurement with an oscilloscope |
Pulse frequency and duration are shown at the same time as we see a picture of the pulses. We see how pulse width changes when the value of the information changes.


